The first function to start learning DAX is CALCULATE. This function does not have an exact counterpart in Excel, but it is comparable to functions SUMIFS and COUNTIFS . In short, this function applies filters to other calculation functions, thus we can select and include in calculations only the data we need.
=CALCULATE(< statistical expression >, < filter1 >, < filter2 >, ...)
< statistical expression >
Statistical expression should return us the result of the calculation (a value, not a table). For this reason, statistical functions of the type are often used in this setting SUM , MIN , MAX , COUNTROWS etc.
< filter1 >, < filter2 >, ...
Filter defines the range of data to be worked on. Conditions for selecting values are specified here.
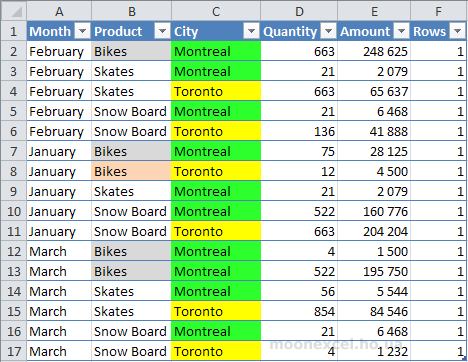
Suppose we have such a table, which is called
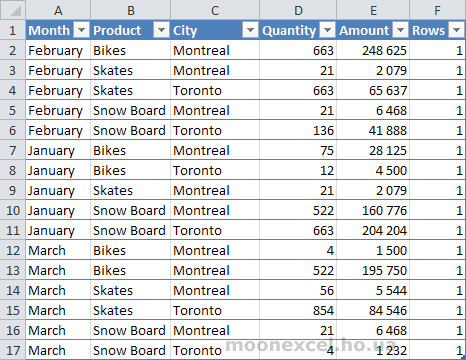
Let's create a summary table based on it and count the number of records for each product.
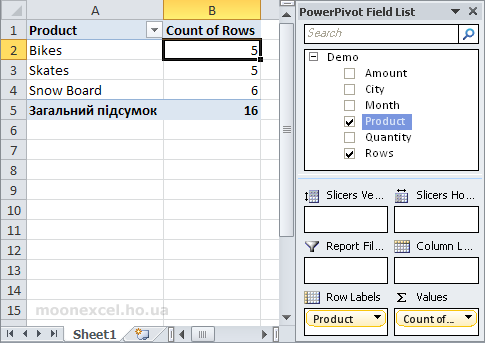
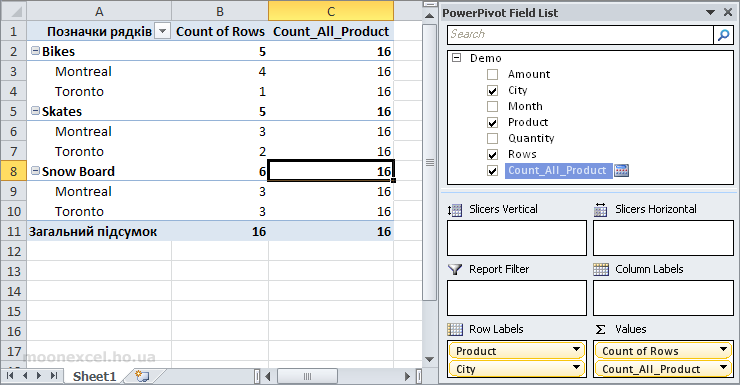
Now let's create a new calculation field

How did we get the numbers in the calculation field Count_All_Product 16 ? The explanation is that we removed for this field all the filters that were applied in the pivot table (each row in the pivot table is a separate filter), using the function ALL() . That is, in other words, a function ALL (
Let's add another field
We see that the numbers are in the field
=CALCULATE(COUNTROWS(Demo);ALL(Demo[Product]))
We changed the argument to the ALL() function by replacing
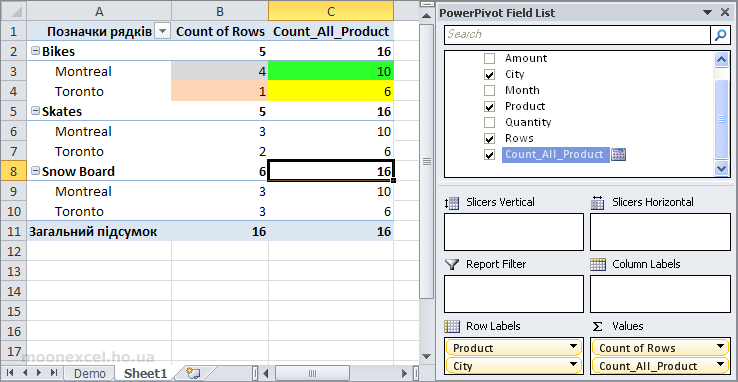
So we see what is on the field

