Let's figure it out as quickly as possible create graph in Excel .
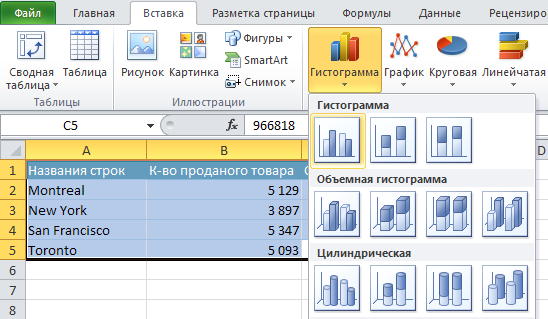
Suppose we have such a table with data, and we need to create a graph from it.

We select our entire table, go to the menu File - Insert - Histogram and choose the type of graph we need:

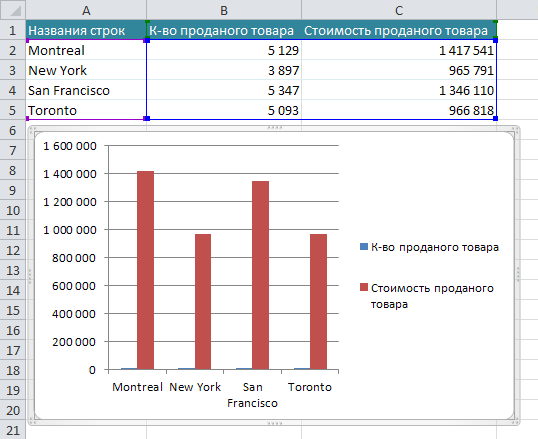
Click and get the following graph:

That's all. How to format the created graph, see below.